
Peptide Study Sample Size: Subjects, Repeated Readings and Pseudoreplication
Learn to distinguish independent subjects from repeated peptide-study measurements, track analyzed group sizes and use a practical evidence-reading worksheet.
A graph with many dots does not necessarily represent many independent subjects. When reading peptide research, identify what was assigned independently, what was measured repeatedly, and how many units reached each analysis. This guide offers a worked reading exercise, not a formula for declaring a treatment effective or safe.
Prepared by Pet Peptide Guide with AI assistance. Sources checked October 10, 2026. Not reviewed by a veterinarian or physician. The examples are fictional teaching examples, not results for any peptide. Human, cell and laboratory-animal findings must not be presented as demonstrated benefits for household pets.
Start with the question behind the number
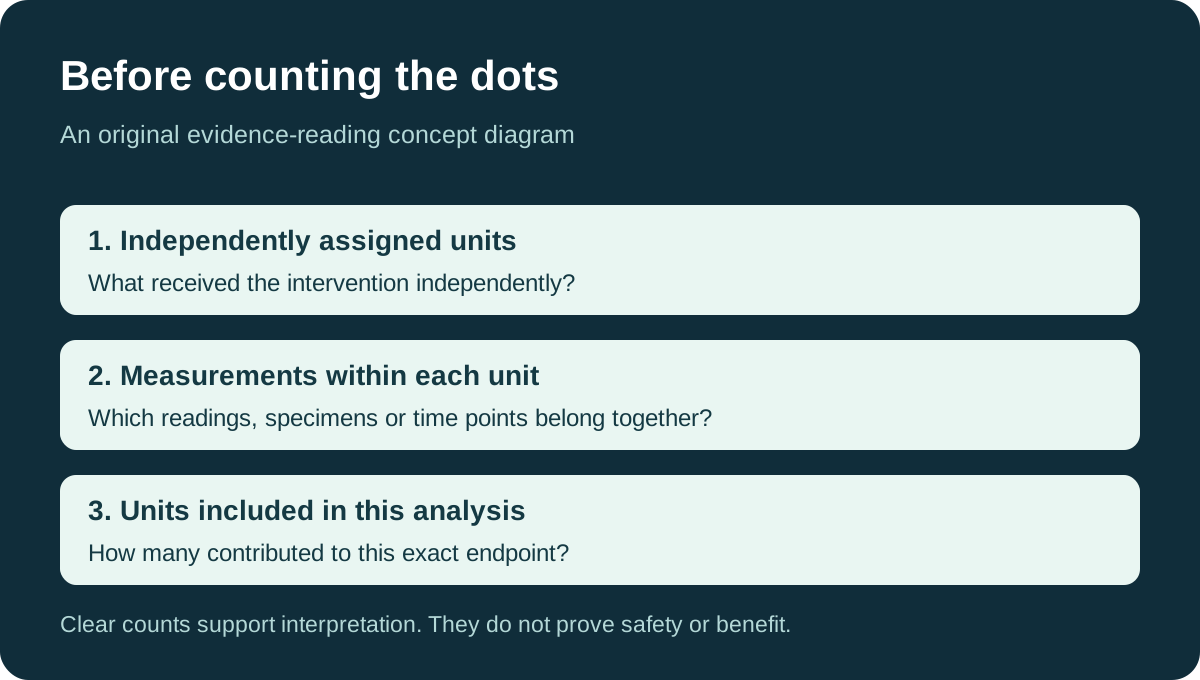
Suppose a social post says that a peptide experiment included “120 observations.” Before sharing the headline, ask what those observations represent. They might be separate subjects, repeated laboratory readings, several images from one specimen, or measurements made at different times. The number alone cannot tell you which interpretation is correct.
Your first reading note should be a sentence, not a score: “The paper compares these groups, using this unit of assignment, for this outcome.” If you cannot fill in one of those blanks from the methods, keep the blank visible. Do not repair an incomplete methods section with assumptions that make the study look larger.
Experimental units and measurements are different
ARRIVE's experimental-unit guidance connects sample size to the entities that receive interventions independently. Depending on the design, that entity can be an animal, a cage, a litter or another unit. Multiple readings from one unit are not automatically independent units. Treating them that way can create pseudoreplication and misleadingly precise conclusions.
This does not mean repeated measurements are useless. They can describe variation within a specimen or changes over time. The question is whether the analysis represents their relationship appropriately. A reader should look for the stated unit and the statistical approach, rather than deciding from the graph alone that every dot is independent or that every repeated-measures study is flawed.
A fictional graph with 24 readings
Imagine a teaching example with two groups, A and B. Four independently assigned animals are in each group. The laboratory measures the same endpoint three times from each animal's specimen. There are eight animals and 24 readings overall. The experimental assignment in this example happened at the animal level.
A caption saying only “24 samples” would leave an important question unanswered. Our reading note would instead say: “Four independently assigned animals per group; three repeat readings per animal; eight animals overall.” That wording preserves the useful laboratory detail without describing 24 animals that were never studied.
Now change the imaginary setup: three photographs are taken from each specimen rather than three instrument readings. The tally is still 24 images, but renaming the measurements does not create new animals. A larger folder of images is not, by itself, a broader test of the finding across biological subjects.
The lesson is to draw the data's family tree. Write “group → animal → specimen → reading” on a page, then circle the level at which the intervention was assigned. This simple sketch is an original reading aid. It cannot replace a statistical review, but it helps you ask a precise question about the methods instead of arguing about an unexplained number.
| Count | What it describes | What it does not establish |
|---|---|---|
| Two groups | The comparison being made | Two independent replications of a study |
| Four animals per group | Independent assignments in this example | A universally adequate sample size |
| Three readings per animal | Repeated observation of each specimen | Three additional animals |
| 24 readings overall | The total measurement count | 24 independent subjects |
Separate the starting group from the analyzed group
ARRIVE's sample-size reporting guidance asks for exact group sizes at the start, plus totals. Starting numbers can differ from the numbers ultimately analyzed. The total animal count also helps identify reuse across experiments.
In our fictional worksheet, suppose one specimen cannot be read because its label is damaged. The study may have started with four animals in each group, while one particular endpoint contains four animals contributing in A and three in B. Write both numbers and the stated explanation. Do not silently change “started with eight” into “eight contributed to every result.”
Nor should a missing result automatically be called manipulation. The useful question is whether the loss is explained and whether it matters for interpreting the comparison. If the reason is inaccessible, record “reason not established from the material reviewed.” An honest unresolved question is better than either an accusation or an invented reassurance.
Read the denominator for each endpoint
ARRIVE's analysis-count guidance calls for the exact number analyzed for each group and outcome, with losses accounted for. Absolute counts are more informative than a percentage alone, and repeated time-point measurements need a clear account of which animals were measured when.
Build two rows in your note if a paper has two endpoints. A laboratory marker and a movement score may use different sets of observations. Avoid carrying a sample count from the first figure into the second without checking its legend. Our biomarker guide explains the separate problem of turning a marker change into a claim about clinical benefit.
What this check cannot decide
There is no universal cutoff in this worksheet that makes a peptide study “large enough.” The question, design, expected variability and analysis matter. This article does not calculate statistical power or reanalyze anyone's data. A transparent count is necessary for understanding a study, but it is not a complete quality rating.
Likewise, a clearly reported human experiment remains human evidence. A well-described cell experiment remains a cell experiment. Better counting does not remove the species, preparation or outcome gaps discussed in our general research-reading pillar.
FDA's animal-drug approval process separately considers safety, effectiveness, manufacturing and labeling for the intended use. Reporting guidelines do not grant approval. This article makes no compound-specific safety or efficacy conclusion and gives no dosing or administration instructions.
Your five-line sample-size note
- Comparison: Which groups and endpoint am I describing?
- Assignment: What was independently assigned to the intervention?
- Measurements: Were there multiple specimens, readings, images or time points within each unit?
- Accounting: How many units started and how many contributed to this exact analysis?
- Limit: Which methods, exclusions or relationships remain unclear?
Attach that note to the exact figure or table, not just the article title. Check the current paper and linked notices with our publication-version checklist. If the claim concerns harm, use the distinct adverse-event guide rather than treating the absence of reported events as a safety guarantee.
For a pet-care discussion, bring the source and your unanswered questions to a veterinarian using the appointment checklist. The aim is a clearer evidence conversation, not a home experiment or a product recommendation.
Sources and scope
This is an introductory guide or original comparison framework, not a systematic review or a product recommendation.
- ARRIVE: Experimental unit — Independent assignment, hierarchical measurements and pseudoreplication.
- ARRIVE: Sample size at allocation — Starting group sizes, totals and distinction from analyzed samples.
- ARRIVE: Exact analyzed numbers — Endpoint-specific group counts and accounting for exclusions.
- FDA: Animal Drug Development & Approval Process — Approval is separate from research reporting and evaluates intended use.
Source checked October 10, 2026. A general context source does not establish a named product’s benefit.